21
Figure 3 Ground cover. The figure also shows the 1m
3
frame which was used for the quadrat sampling
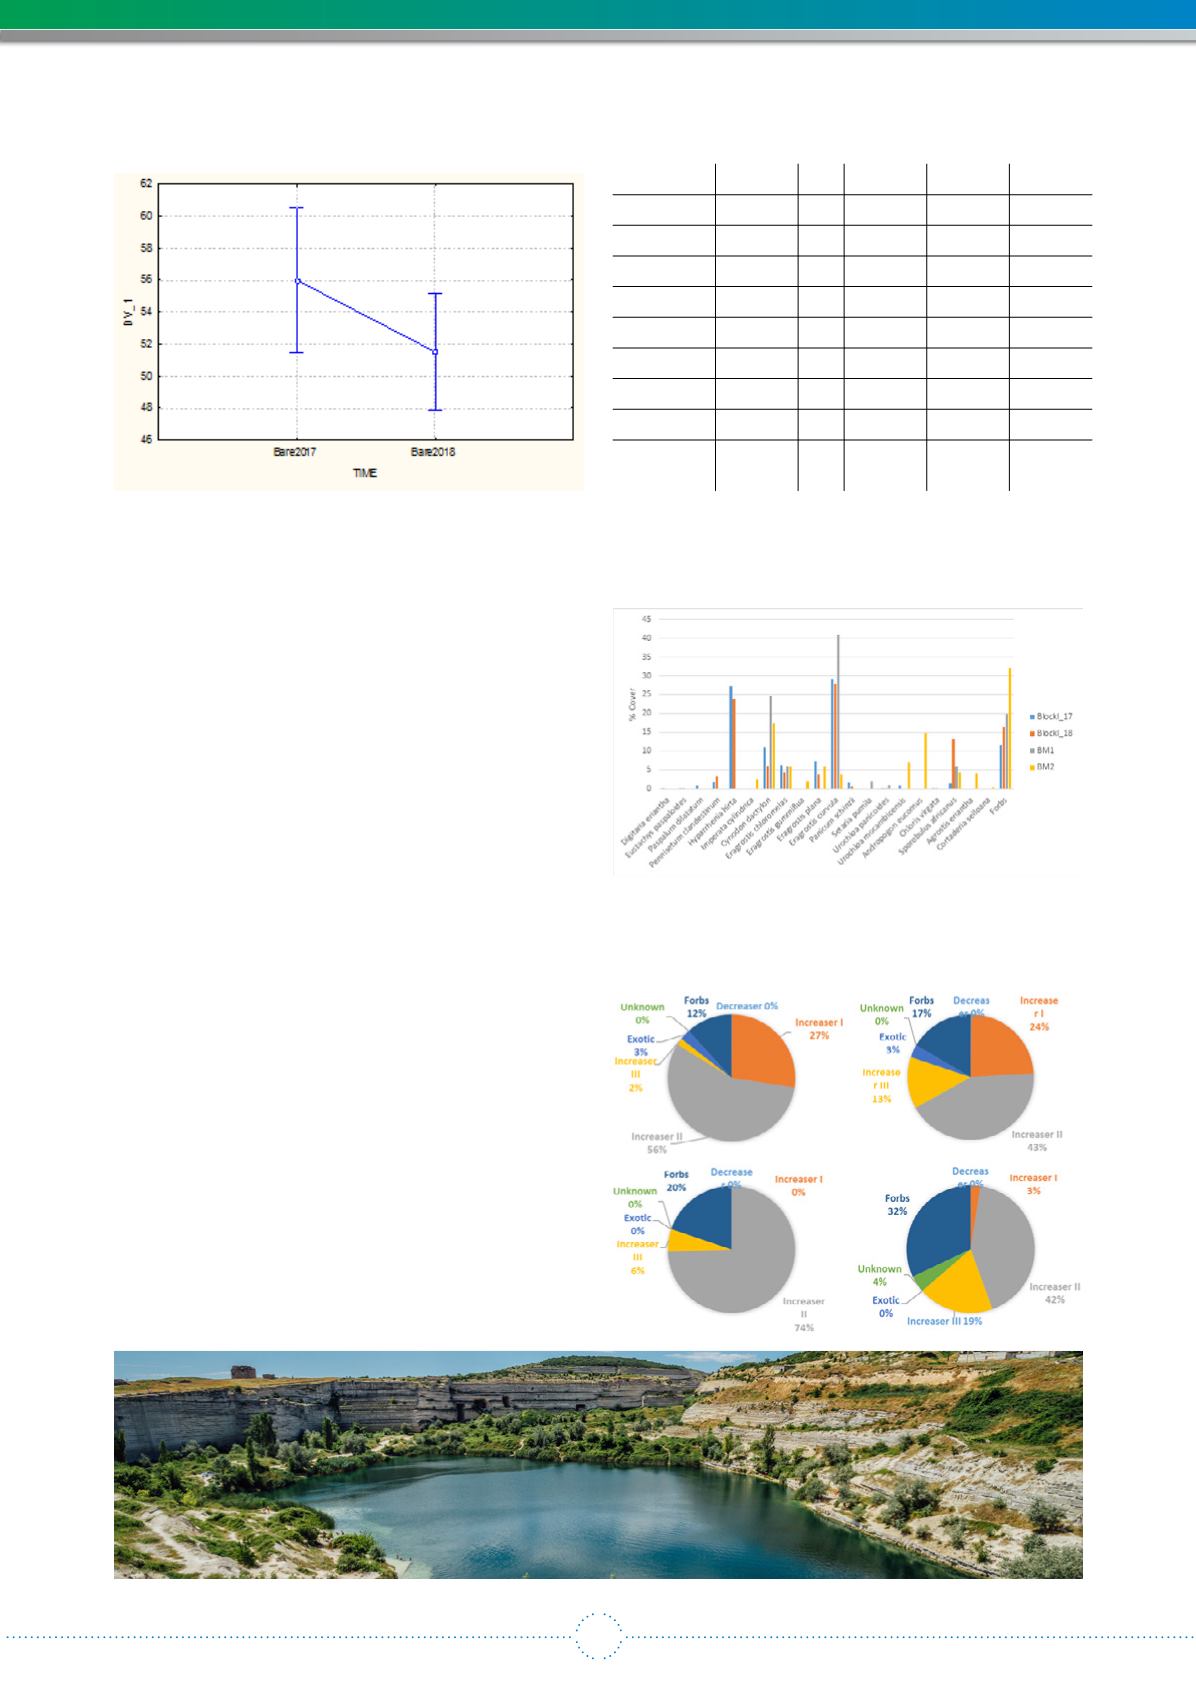
Figure 4 Change in percentage bare ground between 2017
and 2018. Error bars indicate 95% confidence limits
One of the main problems of the rehabilitated site was the
poor vegetation cover (Figure 3). On average the amount of
bare ground was 56% in 2018 versus about 10% in the two
benchmark sites. The effect of the exclosures on this aspect of
the vegetation was tested using repeated measures, ANOVA.
The results are shown in Table 1. The factor marked InOut
represents the comparison between samples taken inside
and outside the exclosures. It appears that the exclosures
have no significant effect on the percentage bare ground.
The significant effect of exclosure (Excl) indicates that there
are differences in ground cover between exclosures (location
effect) and significance of the factor time indicates that there
is a difference between the two years (Figure 4). Finally, the
significant interaction effect of time and exclosure means that
the effect of time was not the same for all exclosures.
Species composition
The species composition of the rehabilitated and the two
benchmark sites are shown in Figure 5. The rehabilitated
site has a high density of
Hyparrhenia hirta
(thatch grass), a
species which was completely absent from the benchmark
sites.
Eragrostis curvula
, a poor quality grazing grass, and is
highly abundant in the rehabilitated site and dominant in the
benchmark site 1, but not very prominent in benchmark site
2. Benchmark site 2 has a few species that do not occur in the
other sites, such as
Urochloa mocambicensis
(buffalo grass) and
Agrostis eriantha
(bentgrass).
Grasses can be classified for their ecological properties
as Decreaser, Increaser I, Increaser II and Increaser III.
Decreasers are generally highly palatable grasses which
disappear if the veld is poorly managed. A healthy grassland is
rich in decreasers. In the areas surveyed there are no decreasers
at all (Figure 6), which means that neither the rehabilitated site
nor the two benchmark sites are healthy.
Table 1 Repeated measures ANOVA results for bare ground
data. Significant effects are in bold italic font
SS
df
MS
F
P
Intercept
346737.0 1 346737.0 918.34 0.0000
InOut
760.7 1 760.7 2.0148 0.1635
Excl
12224.1 9 1358.2 3.5973 0.0023
InOut*Excl
3240.1 9 360.0 0.9535 0.4915
Error
15102.7 40 377.6
TIME
602.7 1 602.7 5.2794 0.02689
TIME*InOut 194.7 1 194.7 1.7055 0.19903
TIME*Excl
3660.7 9 406.7 3.5627 0.00250
TIME*
InOut*Excl
1344.7 9 149.4 1.3087 0.26301
Figure 5 Species cover by site. Block I: rehabilitated site in
2017 and 2018, BM1: benchmark site 1, BM2: benchmark
site 2
Figure 6 Relative abundances of different plant types.
A and B: rehabilitation site in 2017 and 2018, C: benchmark
site 1, D: benchmark site 2
A
B
C
D


