22
Grazing capacity and grazing intensity
Using the data for abundances of different grass types, biomass
and area it is possible to estimate the grazing capacity or the
number of ‘animal units’ an area can support. The following
formula was used: y=(d∙r)/(DM∙f) in which y is the grazing
capacity in hectares (ha) per animal unit, d is the grazing
period in number of days per year, r is the daily dry mass
requirement per animal unit, DM is the dry mass in kg/ha and
f is the utilization factor which depends on the result of a veld
assessment.
The result for the rehabilitation site is 1.025ha/animal unit.
The herd of cattle which is grazing the area is 105 animal units
in size, which means that it would require 107.6ha. The actual
size of the area is 31.8ha, which means that it is likely to be
overgrazed.
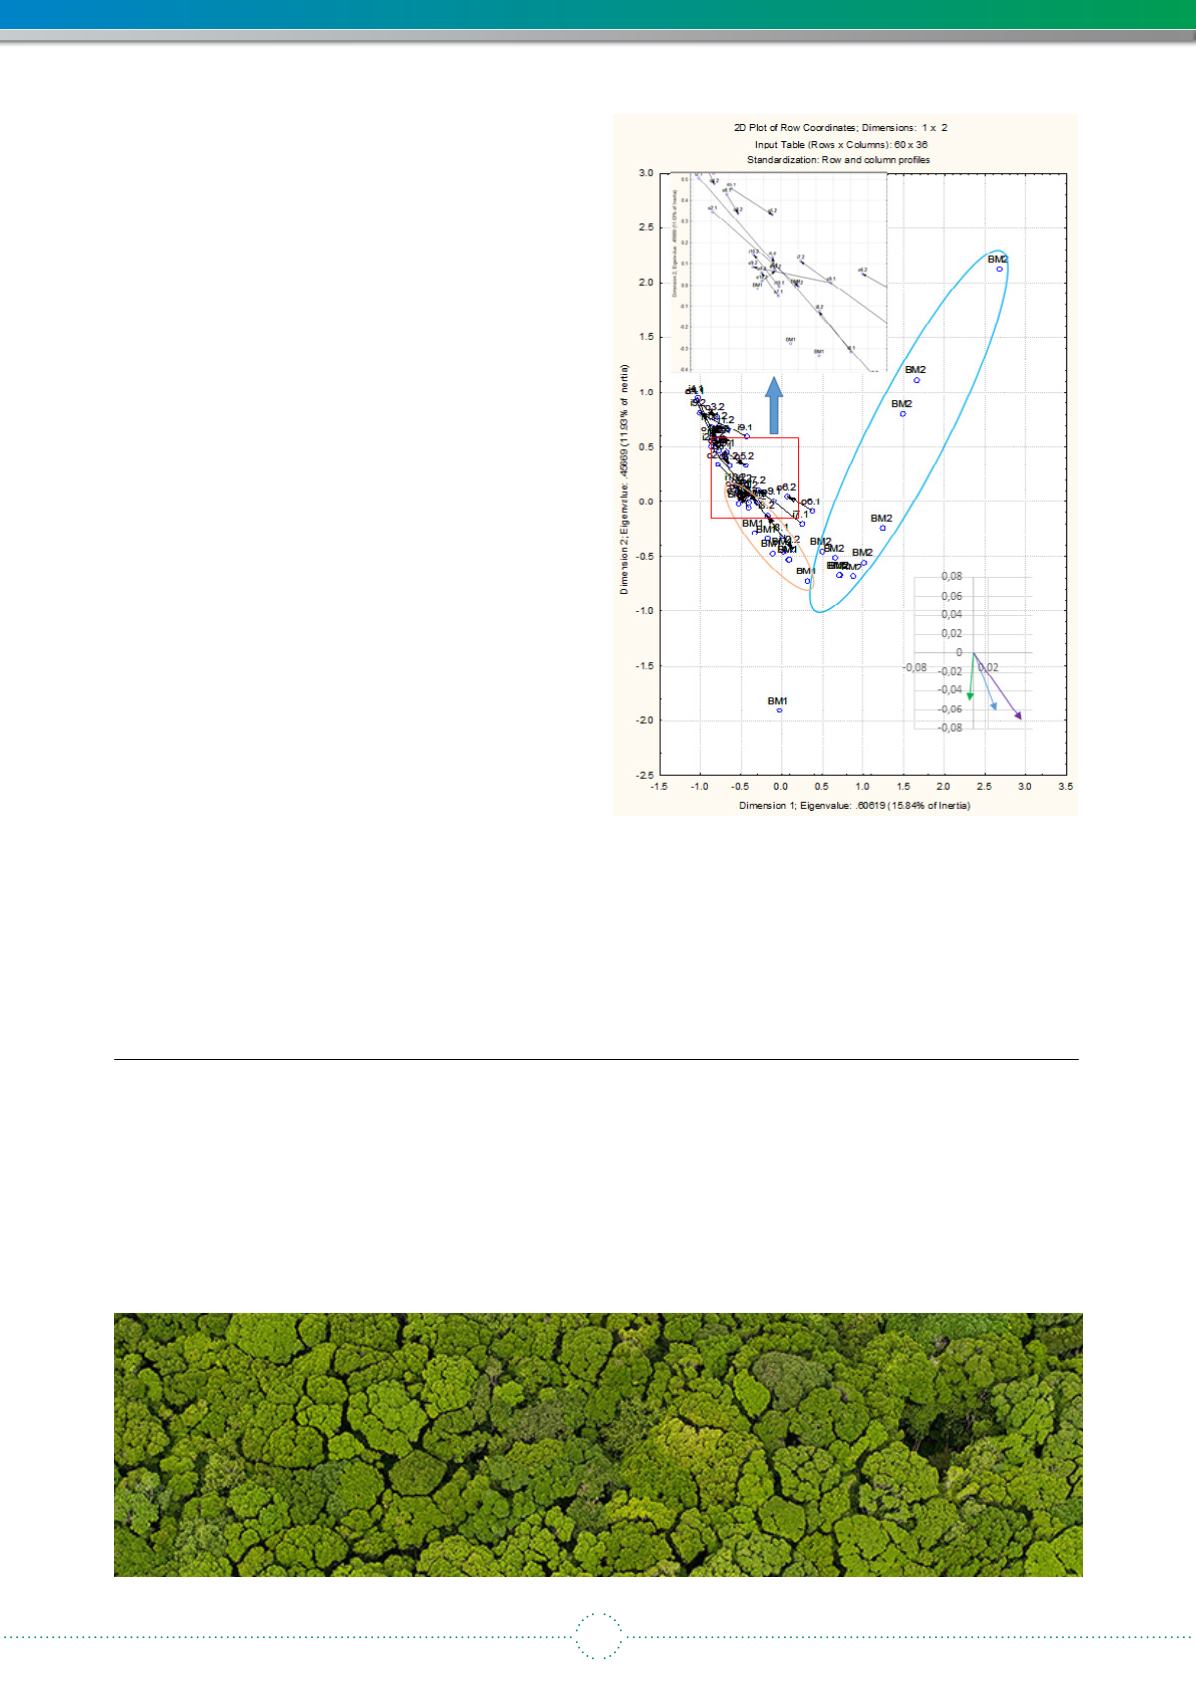
A new method for monitoring the vegetation development
One method for summarising vegetation data is
correspondence analysis. The result of a correspondence
analysis is a plot in which points for sites and species are plotted
along two axes. For our purpose there was no need to plot the
species, so they were left out of the plot. The position of a site
point in the plot depends on its species composition only.
Site points which are close to each other have similar species
compositions, while those that are far apart are very dissimilar.
If samples from two consecutive years are plotted in the same
plot the position of the point from the second year relative to a
point from the same site in the first year reflects a change in the
species composition. In Figure 7 such changes are indicated
by vectors which connect points belonging to samples taken
from the same location a year apart. The vectors vary greatly
both in length and direction. The reason for this may be that a
year is too short for a clear directional change in the vegetation
composition of the whole area to be discernible.
The scatter notwithstanding, we averaged the vectors for the
sites inside the exclosures, outside the exclosures and all sites
together. The average vectors are shown in the insert in the
bottom right of Figure 7. This representation is a magnification
of the actual vectors which are approximately an order of a
magnitude smaller.Thedirectionof the vectors is approximately
towards benchmark site 1, but the change is very slow.
Figure 7 Correspondence analysis of vegetation samples
from the rehabilitation site (2017-18) and the two
benchmark sites. The ovals encircle the points for the two
benchmark sites (save one outlier). The section in the red
square is enlarged to show the vectors. The insert in the
bottom right shows the average vectors, inside exclosures,
outside exclosures, overall average.
Concluding remarks
Currently the rehabilitated site is in a severely degraded state, apparent from both the poor vegetation cover and the
species composition. Therefore, the site has a high risk of erosion. The effect of cattle grazing on the percentage of bare
ground discernible from the comparison between the vegetation inside and outside the exclosures is not yet significant.
However, the exclosures have only been present for one year during which the camp was utilised for grazing for a period of
three months. In the correspondence analysis of the species composition, the average vector for inside exclosures points in
a different direction than the one for outside the exclosures, suggesting that the vegetation develops in different directions.
However, the vectors are too short and there is too much scatter around them to allow for a firm conclusion in this regard. A firm
conclusion would mean extending the study and monitoring the vegetation over a period of five years.


